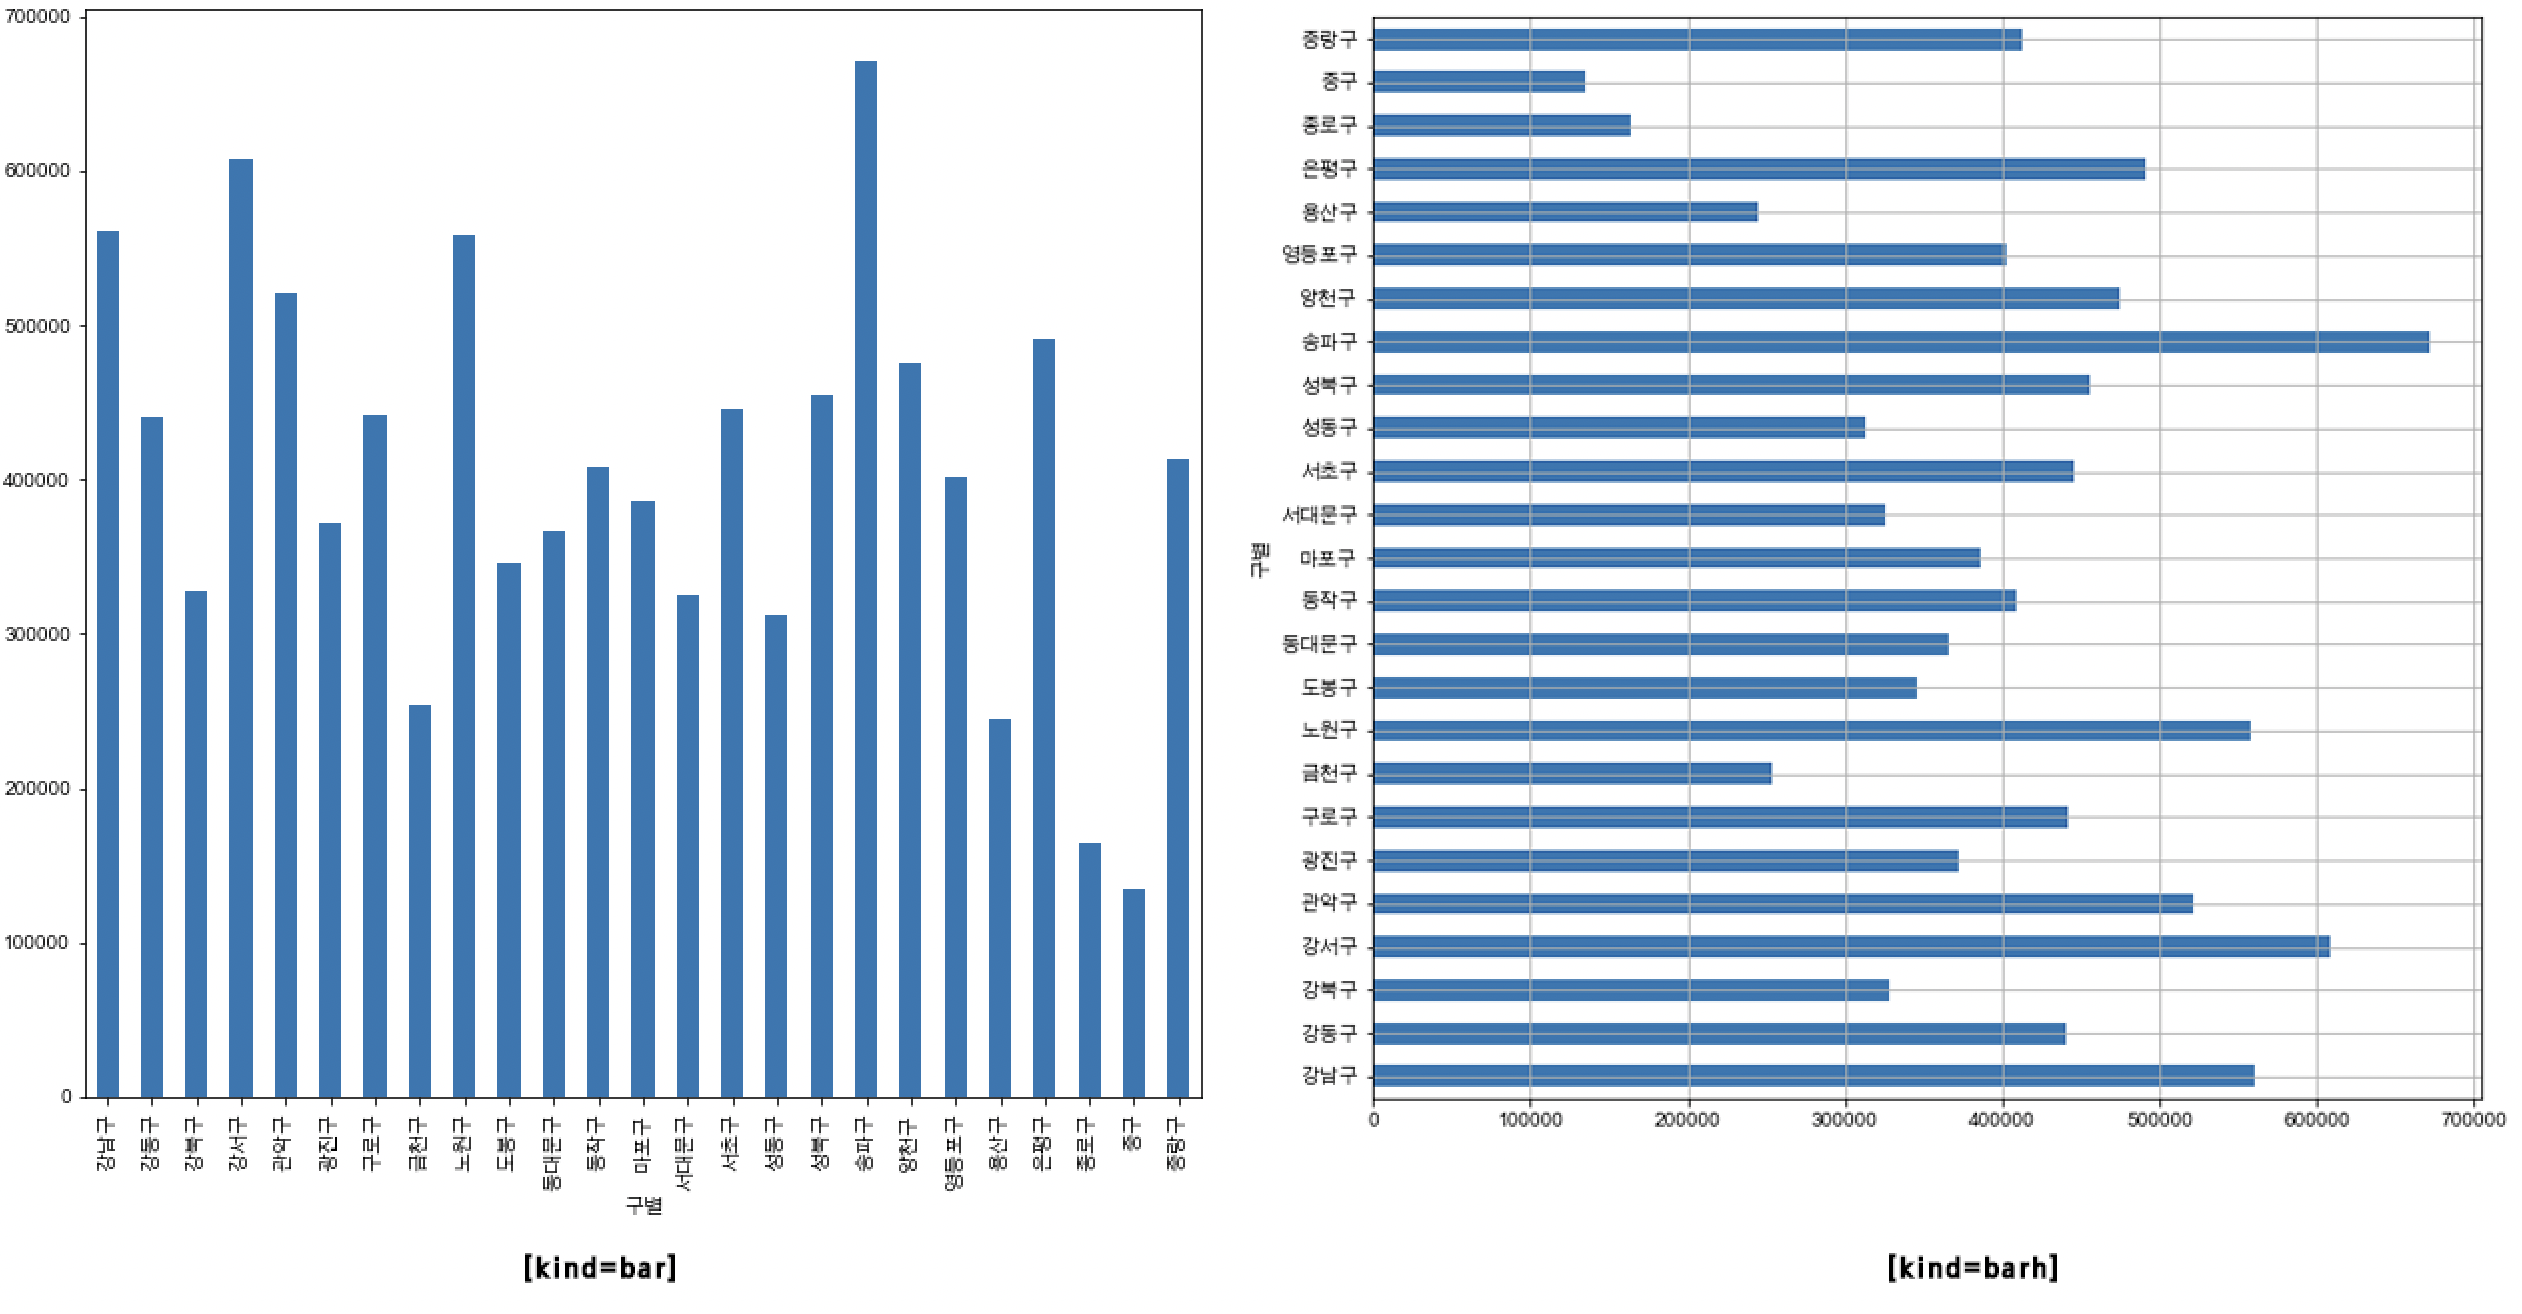
1. plot
- DataFrame의 plot을 이용하면 다양한 그래프를 그릴 수 있음.
2. 그래프 그리기
1) plot(x, y)
- kind : 그래프 종류 ex) line / bar / barh / hist / box / kde / density / area / pie / scatter / hexbin
- title : 그래프 제목
- linestyle : 선의 스타일 설정 ex)linestyle='dashed'
data_result["인구수"].plot(kind="bar", figsize=(10,10));

data_result["소계"].plot(kind="barh", grid=True, figsize=(10, 10));
3. 그래프 정렬하기
1) sort_values(ascending=True/False)
data_result["소계"].sort_values().plot(
    kind="barh", grid=True, title="가장 CCTV가 많은 구", figsize=(10, 10));

data_result["소계"].sort_values(ascending=False).plot(
    kind="barh", grid=True, title="가장 CCTV가 많은 구", figsize=(10, 10));
4. 참고할만한 사이트
20-01 plotting기초 (plot)
####DataFrame.plot(args, kwargs) ##개요 `plot` 메서드는 matplotlib 라이브러리를 이용해 dataframe 객체를 시각화 하는 메서드 ...
wikidocs.net
Plot types — Matplotlib 3.5.2 documentation
Overview of many common plotting commands in Matplotlib. Note that we have stripped all labels, but they are present by default. See the gallery for many more examples and the tutorials page for longer examples. Unstructured coordinates Sometimes we collec
matplotlib.org
'Python > Python 데이터분석' 카테고리의 다른 글
| [Matplotlib] 데이터 시각화 (0) | 2022.05.27 |
|---|---|
| [Matplotlib] 산점도(Scatter Plot) 그리기 (0) | 2022.05.27 |
| [Matplotlib] Matplotlib 이란? (0) | 2022.05.26 |
| [Pandas] 데이터 병합 (0) | 2022.05.25 |
| [Pandas] 함수 사용 (0) | 2022.05.25 |
![[Pandas] 그래프 그리기(plot)](https://img1.daumcdn.net/thumb/R750x0/?scode=mtistory2&fname=https%3A%2F%2Fblog.kakaocdn.net%2Fdna%2FZtw6z%2FbtrDfC8bekP%2FAAAAAAAAAAAAAAAAAAAAAGFu9wcf0P-Xtf5uCyOGJ7ox2CrAr2g_KA-40Dmwky3r%2Fimg.png%3Fcredential%3DyqXZFxpELC7KVnFOS48ylbz2pIh7yKj8%26expires%3D1764514799%26allow_ip%3D%26allow_referer%3D%26signature%3DzNIbzAmOHVsUi4Ljh%252F%252FBPQjQJY8%253D)